Playing Checkers with Fourier
The other day, as I was going through the FFTW documentation, I came across this little pearl in the FAQ:
For human viewing of a spectrum, it is often convenient to put the origin in frequency space at the center of the output array, rather than in the zero-th element (the default in FFTW). If all of the dimensions of your array are even, you can accomplish this by simply multiplying each element of the input array by (-1)^(i + j + …), where i, j, etcetera [sic] are the indices of the element. (This trick is a general property of the DFT, and is not specific to FFTW.)
This, like so many properties of Fourier’s Famous Transform, at first seemed miraculous. To help understand the problem they are addressing in the FAQ, let’s take a look at an image, and the resulting transform you see after applying a standard FFT.
Here is a grayscale photograph of some telephone wires in the Cowley neighborhood of Oxford…

…and the log-transformed modulus of the Fourier transform of the wires image.

The FFT libraries I’ve used output the DC component at the image origin, taken to be the upper lefthand corner, which is not very conducive to human viewing. As a result, libraries that deal with the Fourier transform will typically provide a shift function, such as ITK’s itk::FFTShiftImageFilter class. The output of such a filter puts the DC component in the center. However, the FAQ from the FFTW library, quoted above, states that multiplying each pixel by negative one taken to the power of the sum of the indices should accomplish this for us. There are two central points one needs to realize in order to understand conceptually why this should be so.
- Negative one taken to the power of the sum of the indices represents a checkerboard pattern of alternating ones and negative ones, and this represents the highest frequency that can be represented by the transform. The Fourier transform of this image is a single point in the center of the spectral domain.
- Multiplication in the spatial domain corresponds to convolution in the frequency domain, and convolution by a single point results in a shift by that point.
Here, we see the checkerboard pattern resulting from taking alternating powers of negative one…

…and the Fourier transform of the checkerboard pattern.
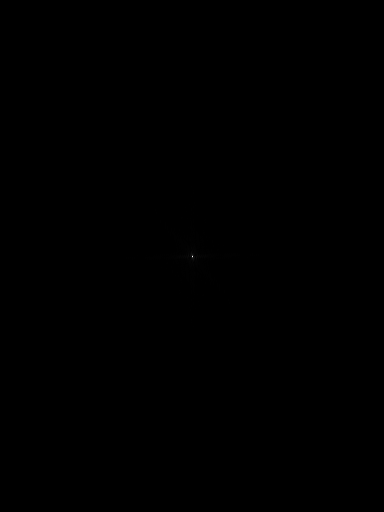
The single point that appears in the center of the image represents the highest frequency in the spectrum. Moreover, as we are convolving the spectrum with this point (i.e., multiplying the image by its inverse transform), we are shifting the spectrum by the point’s offset from the origin, and therefore putting the DC component in the center of the image.

Very cool.
The source code for this post, written in c++11 using the ITK library, is over at Bitbucket.